
The key to understanding whether an attacking player will hit the ground running against particular sides is in knowing how adept particular teams are at defending in certain areas of the pitch. This article provides a zonal analysis of different teams’ attacking and defensive strengths and weaknesses in midfield. It will also aim to identify the strongest midfield options over the coming six weeks based on their team’s strengths and their opposition’s weaknesses.
Methodology
In order to ascertain each team’s strong and weak areas on the field when attacking and defending, I used the members statistics tables to firstly calculate the total numbers of chances conceded, as well as created. Using this, I then broke the data down by the area of the field these chances took place in: the left zone, centre zone or right zone. For clarity, it is worth noting that both left and right zones were from an attacking perspective (so the right zone would be right midfielder vs. left-back and the left zone would be left midfielder vs. right-back).
With this information, I was then able to derive the percentage of chances conceded / created in each zone of the field. This was tested for significance at a 0.95 level relative to the average number of chances conceded / created within that area. Teams above that figure could be said to be significantly stronger in that area of the field at creating chances, and vice versa for conceding chances. This then formed the fulcrum of the findings and told me which teams were creating significantly more chances than others in each zone of the field.
However, for the purpose of this article, I felt that merely basing it on numbers wasn’t enough. Obviously, sides like Chelsea, Arsenal and Manchester City are likely to create significantly more chances in all three zones of the field. Similarly, the likes of Burnley, QPR and Leicester tended to concede a significant amount of opportunities all over the park. Thus, I felt it would be of little value here to include these teams in all three zones.
As a result, by taking the percentage of chances created in each zone into account, I have limited teams to no more than two zones on the field. Consequently, in order to be included in each zone, a team must have created a significantly greater number of chances in that zone relative to other teams AND that zone should have represented a significant proportion of their chances created or conceded as a whole (that figure being 36% or more).
This gave me a list of several teams who are significantly stronger / weaker than their opposition in each zone of the field.
Results
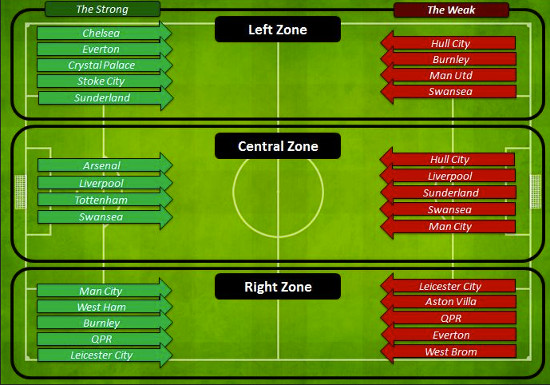
I have pulled the findings together on the pitch below. This image is also available by clicking here. The red arrows on the right-hand side represent the teams that are weakest in each area of the pitch, that is, teams who have a significantly greater number of chances conceded relative to the average in that zone. Conversely, the arrows on the left hand side show the teams that are strongest in each area of the pitch – so those that create a significantly greater number of chances and / or percentage of chances in that area relative to others.
With a view to keeping this article a reasonable length, I am not going to post the actual data for the top teams here, but I can make this available in the comments section should anybody wish to see it.
So, what does this all mean from a Fantasy perspective? Well, now that we know which areas of the field are strongest and weakest for different teams, we can begin to factor that in to our fixture analysis in order to identify promising fixtures for players coming up.
In order to understand the difficulty of the top teams’ fixtures in each zone, I have provided each team with a coefficient, from 1-20, based on the chances conceded from that zone to date. The higher the coefficient, the more chances that team concedes in that zone of the pitch relative to other teams.
With these coefficients in place, I then looked at the teams that were strongest at creating chances in each of the three areas of the park and the corresponding player(s) we would typically be looking at in those positions of the field from a Fantasy perspective. I then ranked them in order of difficulty in terms of opposition over the next six Gameweeks, with a minimum figure of 21 (1+2+3+4+5+6) and a maximum figure of 105 (20+19+18+17+16+15) possible. In essence, the higher the figure, the easier the run of fixtures.
Left Zone
Chelsea (77/105): Eden Hazard
Everton (68/105): Leighton Baines, Ross Barkley
Crystal Palace (64/105): Yannick Bolasie
Sunderland (61/105): Connor Wickham, Adam Johnson
Stoke City (40/105): Victor Moses
Central Zone
Tottenham (71/105): Christian Eriksen, Nacer Chadli, Ryan Mason
Liverpool (66/105): Philippe Coutinho, Adam Lallana
Swansea (65/105): Gylfi Sigurdsson
Arsenal (61/105): Alexis Sanchez, Aaron Ramsey
Right Zone:
Man City (80/105): Jesus Navas
QPR (79/105): Eduardo Vargas
West Ham (77/105): Stewart Downing, Enner Valencia
Burnley (58/105): Kieren Trippier, Scott Arfield
Leicester (56/105): Rhys James, Leonardo Ulloa
Conclusions
- Eden Hazard has big potential to explode over the next six Gameweeks. Not only is he currently in form, his fixtures are kind in terms of facing sides who are relatively weak at defending that left zone of the pitch. This could well be his time to shine.
- Similarly, the fixtures fall kindly for the likes of Jesus Navas, Leighton Baines, Eduardo Vargas and Stewart Downing, whilst chances created from that side of the pitch demonstrates further potential for the likes of Aguero, Lukaku, Austin and Sakho respectively.
- Whilst not an exhaustive tool, there are some strong teams who are coming up against equally strong teams at defending that area thus far. These being Burnley, Leicester (right zone), Arsenal (central zone) and Stoke (left zone). Thus, owners of Moses, Trippier and Sanchez may be slightly wary – although do bear in mind that these players are still creating chances with regularity, and will likely continue to do so regardless of fixture.


9 years, 4 months agoExceptional work. A really strong argument for drafting in Hazard.