Community Submissions

Gameweek 12 Table Toppers (2011-2014)

There has been lots of discussion in recent weeks as to whether, with 12 goals already this season, Leicester striker Jamie Vardy can continue his amazing form. This got me thinking whether, historically, the fact that players and teams have been leading various metrics by Gameweek 12 is a good predictor of whether they will be leading performers for the remainder of the season.

Last Four Years Table Toppers

Looking at the various stats across the four seasons 2011-12 to 2014-15 leads to:

Top pic 1

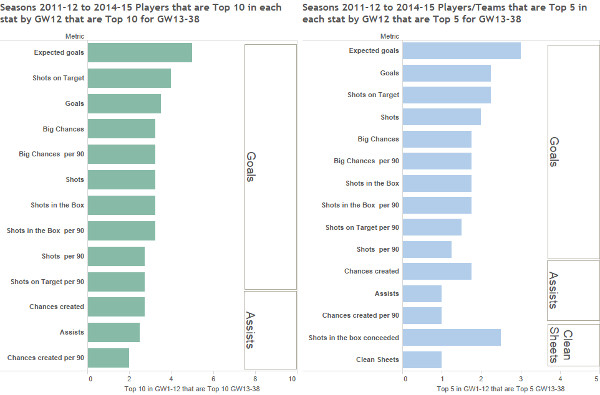
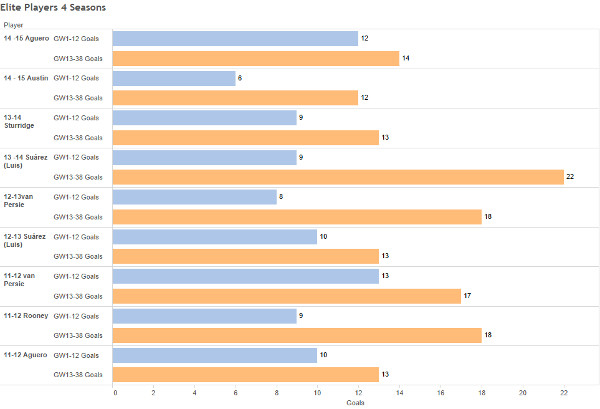
There are a couple of ways to read this. One is that current leaders for goals, assists and clean sheets historically on average have not produced a high proportion of the leaders for the remainder of the season. For example only three to four of the current top 10 goalscorers will be the top 10 goal scorers for the rest of the season. In fact across the last four seasons only the elite players in general have achieved the feat of being in the top five goalscorers by Gameweek 12 and top five goalscorers for Gameweeks 13-38:

Top pic2

Expected Goals

The other way to read it is that current leaders in expected goals in particular followed by goals and shots on target are good predictors of the top five scorers for the rest of the season. I only have Paul Riley’s expected goals  for 2014-15 so a smaller sample size but from the top five of that model by Gameweek 12, three were in the top five goalscorers for the rest of the season and five were in the top 10.

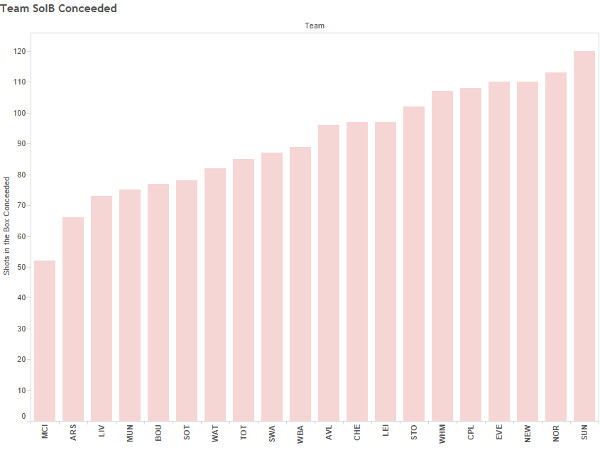
Clean Sheets have a good hit rate for the top five teams for the rest of the season if you use the current leaders in shots in the box conceded.

So looking at the season so far using the top 10 for Paul Riley’s expected goals:

Top pic 3

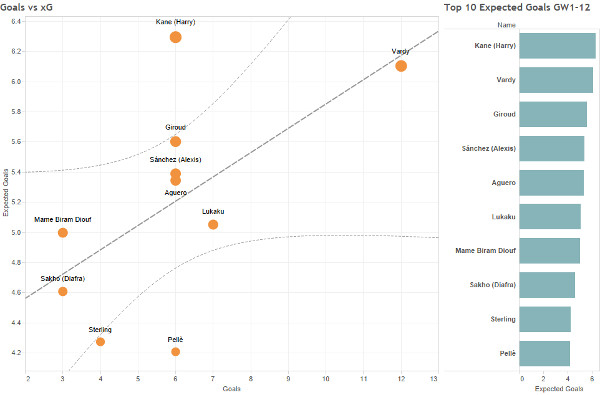
If it follows last year, if these players stay fit, and in Giroud’s case, if he is getting the minutes, it seems like they are good predictors for highest goalscorers for the rest of the season.

Similarly looking at leaders for shots on target as this has a bigger sample size (showing 12 as bottom three are tied):

Top pic 4

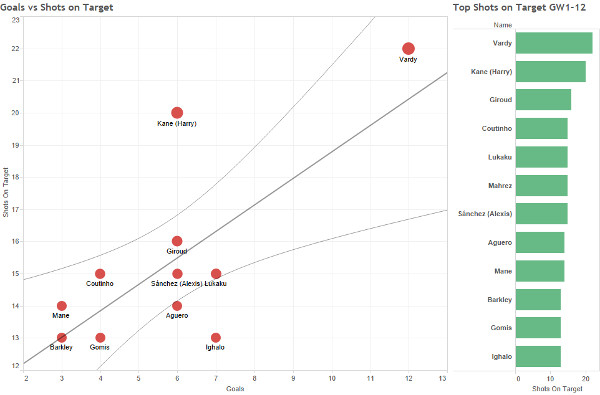
If the future mirrors the past four seasons then two to three of the current top five will be in the top five for the rest of the season. Four of the top 10 currently will be in the top 10 goalscorers for the rest of the season.

Of those to drop off, if I had to bet right now that would be Watford’s Odion Ighalo, Swansea’s Befatembi Gomis, Everton man Ross Barkley, Southampton midfielder Sadio Mane, Riyad Mahrez of Leicester and Liverpool’s Philippe Coutinio and Arsenal striker Olivier Giroud depending on Theo Walcott’s fitness in terms of reducing his minutes.

Harry Kane of Tottenham, Arsenal’s Alexis Sanchez, Manchester City’s Sergio Aguero and Vardy seem good bets depending on fitness. As I highlighted in Gameweek 10, Kane in particular with a relatively high ratio of shots on target to current goals scored even after his recent run, looks very good to me for a positive mean regression (so points for us).

Clean Sheets

Top pic5


It is likely that two to three of Manchester City, Arsenal, Liverpool, Manchester United and Southampton will have the most clean sheets for the rest of the season. I anticipate that Bournemouth will concede far more shots in the box as they continue to struggle with life in the Premier League.

rakkhi Love my football, love my stats, hoping to improve each year. Go the gunners! @rakkhis on Twitter Follow them on Twitter

27 Comments Post a Comment
    • 10 Years
    8 years, 5 months ago

    Lots of nice graphs Rakki but I've gotta say the boot-strapping on that ExG graph is ridiculously wild!

    1. Zasa
      • 9 Years
      8 years, 5 months ago

      +1

      This article deserves way more love, xG/xGC/xA & their corresponding graphs are way more useful & versatile metrics than any one stat or two stats you'll find in members tables imo.

  1. J0E
    • Fantasy Football Scout Member
    • Has Moderation Rights
    • 14 Years
    8 years, 5 months ago

    Thanks for this. Hoping Vardy can carry this on. Will be on more than 30 goals if he can this season.

  2. Bedknobs and Boomsticks
    • 14 Years
    8 years, 5 months ago

    I like it, but surely the central line for the Xgoals vs goals graph should run through 4,4 and 6,6 rather than 4,2 and 6,11? That way it would indicate deviation between Xgoals and reality.

    1. rakkhi
      • Fantasy Football Scout Member
      • 13 Years
      8 years, 5 months ago

      Thanks. The trend line is auto generated as a correlation between goals and expected goals for these top 10 this far. You can also look at it the way you indicated

      1. RedLightning
        • Fantasy Football Scout Member
        • Has Moderation Rights
        • 13 Years
        8 years, 5 months ago

        But if the central line does not go through 4,4 and 6,6, does that not suggest that the expected goals values are rather inaccurate?
        Or that the graph is based on too little data?
        Or that the expected goals are the goals expected from a different set of players - perhaps they might be based on all players rather than just on the leading ones?

        The biggest anomalies appear to be Kane and Vardy.
        Vardy has scored the number of goals to be expected from the number of his shots on target, but twice as many as to be expected from his expected goals - this suggests that he is very efficient at scoring from half-chances.
        Kane however is the opposite - his actual goals are close to his expected goals, but he only scores half the number to be expected from the number of his shots on target - so many of his shots on target must be easier to save or block.

        Three things that the graphs do not appear to take into account though are the strength of the opposition, whether the players are fixture-proof, and how many matches they have played. These could have a big effect on some players either improving or regressing.

        1. Dino
          • Fantasy Football Scout Member
          • 14 Years
          8 years, 5 months ago

          You're last paragraph is the biggest problem with this xG model imo, the only other problem I can think of with it that you haven't mentioned is game state. Imo Leicester's attacking players have benefited massively due to them having to throw the kitchen sink at it since they have been behind in so many games. Whether they can keep coming from behind and scoring remains to be seen.

        2. RedLightning
          • Fantasy Football Scout Member
          • Has Moderation Rights
          • 13 Years
          8 years, 5 months ago

          Actually, I suppose that the closeness to the central line does allow for the number of matches played, but the absolute values do not.

        3. rakkhi
          • Fantasy Football Scout Member
          • 13 Years
          8 years, 5 months ago

          There is limited data at the moment, you would expect both to align over the season and prior research has shown this to be the case but for now there is divergence. There is even greater divergence in the trend line I have shown as it is only for these 10 players. You can certainly look at the xG for all players vs their goals to get the current correlation.

          Yes Vardy is an anomaly on expected goals at the moment so some regression there in the rest of the season should occur. He may still be one of the top 5 scorers for the rest of the season even despite that. Think that Paul's model also only looks at non penalty goals and Vardy's penalty goals maybe a fair bit of the difference at the moment.

          Kane does have about what expected goals predict but he also has a lot of shots on target for the goals he as scored. So an increase in his goal production I think is a reasonable prediction.

          The historical data of course takes opposition into account. It is showing that across 4 seasons, those players that were leading in the stats in expected goals and shots on target in particular are the best performers across the rest of the season. Arguably in 12 games some players have not played against the best opposition and some have had an easy run but 12 seems to be sufficient to at least have this 50% predictive ability. Of course the more data and games we get e.g. by GW19 when everyone has played everyone you would expect that percentage to go up.

          1. RedLightning
            • Fantasy Football Scout Member
            • Has Moderation Rights
            • 13 Years
            8 years, 5 months ago

            Thanks, Rakkhi.

            12 games is probably enough for the majority of players, but not for players like Lukaku who have had to face all the top teams in the first quarter of the season, or players like Vardy who will now be facing tougher opposition than they have had to face so far.

            1. rakkhi
              • Fantasy Football Scout Member
              • 13 Years
              8 years, 5 months ago

              You could certainly be right. Even top 10 expected goals has 5 of the current top 5 miss out for the rest of the season. Vardy and Lukaku could be in that bucket. Looking at their overall stats though I'm happy to keep them for next 5 games at least with maybe Vardy becoming Aguero at some point.

          2. RedLightning
            • Fantasy Football Scout Member
            • Has Moderation Rights
            • 13 Years
            8 years, 5 months ago

            As you say, the figures for the 4 seasons suggest that the first 12 matches might give a 50% predictive ability.

            Perhaps if you could also take the difficulty of the first 12 matches into account then it might be easier to predict which of the players would be most likely to be in this 50%?

            1. rakkhi
              • Fantasy Football Scout Member
              • 13 Years
              8 years, 5 months ago

              Yup good idea but getting data on historical fixture difficulty is hard. If FFS provided historical tickers I could do this in a future piece. Otherwise would be going through fixtures manually and assigning my own judgement weighting

              1. RedLightning
                • Fantasy Football Scout Member
                • Has Moderation Rights
                • 13 Years
                8 years, 5 months ago

                Probably not worth the trouble of doing that for the four seasons, but perhaps it might be worth noting which players have had a particularly tough or easy set of fixtures for their first 12 matches this season.

                Kane, Vardy, Giroud and Sanchez are in the top 5 for all three measures - expected goals, shots on target and actual goals.
                Vardy may regress a bit as his fixtures get more difficult, but I would think that all 4, along with Lukaku and Aguero, stand a good chance of still being in the top 10 goal-scorers at the end of the season, injuries and rotation permitting.

              2. RedLightning
                • Fantasy Football Scout Member
                • Has Moderation Rights
                • 13 Years
                8 years, 5 months ago

                The historical fixture difficulty would largely disappear if you did your comparisons for the last 4 years between GWs 1-19 and 20-38 instead of between 1-12 and 13-38.

                The quantity of data would be somewhat greater by GW19 too, especially for the players not in the top 5, and this should help to separate some of the wheat from the chaff.

                The most significant of the underlying stats would appear to be expected goals, shots on target, chances created and shots in the box conceded. It would be interesting to see how these compare with goals scored, assists made and goals conceded after 19 GWs.

                I was particularly surprised at the low the correlation was between being in the top 5 teams for clean sheets conceded after 12 GWS and being in the top 5 teams for GWs 13-28. Does this result from 12 GWs providing too small an amount of data, or from a real difference between the chances of a clean sheet in GWs 1-12 and GWs 13-18? This could perhaps be tested by seeing whether the same low correlation occurs if you compare GWs 27-38 with GWs 1-26.

                1. rakkhi
                  • Fantasy Football Scout Member
                  • 13 Years
                  8 years, 5 months ago

                  Yup I'll repeat for GW19 when it gets there this season and do another post.

                  1. RedLightning
                    • Fantasy Football Scout Member
                    • Has Moderation Rights
                    • 13 Years
                    8 years, 5 months ago

                    🙂

  3. Diva
    • 9 Years
    8 years, 5 months ago

    Interesting read, thanks Rakkhi. Please can you explain how Bournemouth's clean sheets will drop away? They only have one so far. Or is it the underlying data you're expecting to drop away? If so, why? Sorry, maybe something was cut or I've just misunderstood something. Thanks!

    1. J0E
      • Fantasy Football Scout Member
      • Has Moderation Rights
      • 14 Years
      8 years, 5 months ago

      My understanding is that it is underlying stats as it refers to their position in the table of conceding a few amount of shots in the box. I'll add that in to the article though to make it clearer.

      1. Diva
        • 9 Years
        8 years, 5 months ago

        Thanks Jonty.

        1. rakkhi
          • Fantasy Football Scout Member
          • 13 Years
          8 years, 5 months ago

          Yes I meant that even though BOU are in the top 5 for least shots conceded in the box I expect they will not be in the top 5 for most clean sheets for the rest of the season

  4. RedLightning
    • Fantasy Football Scout Member
    • Has Moderation Rights
    • 13 Years
    8 years, 5 months ago

    What are the figures for shots in the box conceded and clean sheets for the top 10 over the last 4 years?

    These figures appear in the top 5 table, but not in the top 10 one.

    1. rakkhi
      • Fantasy Football Scout Member
      • 13 Years
      8 years, 5 months ago

      Thought top 10 didn't have much point with 20 teams. We want to know the teams with the highest clean sheets probabilities for the rest of the season anyway right?

      1. RedLightning
        • Fantasy Football Scout Member
        • Has Moderation Rights
        • 13 Years
        8 years, 5 months ago

        Fair enough, since these two stats apply to teams (of which there are 10) whereas the rest apply to particular players (of which there are many).

  5. SneakyPete
    • 12 Years
    8 years, 5 months ago

    Excellent Article 🙂

  6. Zasa
    • 9 Years
    8 years, 5 months ago

    Another fantastic article Rakkhi, great work!

  7. djpete
    • Fantasy Football Scout Member
    • 11 Years
    8 years, 5 months ago

    Really like this, many thanks!