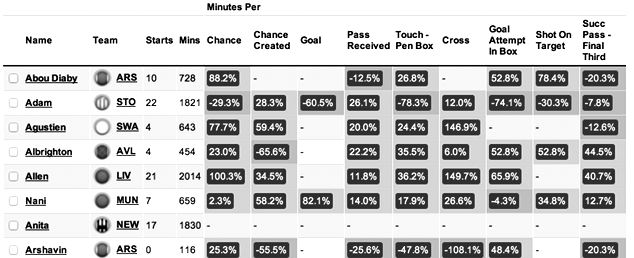
The latest addition to our members area is almost ready to go live. The “Key Performance Indicator” tables or “KPI” tables for short, are designed to use a series of key stats to allow our members to track form or change in performance in players.
For a while now we’ve been looking for a method of using our data to enable our members to assess player form – or at least track some key statistics that can be identified as indicators of form that may influence future Fantasy Football output, whilst also going some way to explain a recent rise or decline.
Firstly, we created tables that track the frequency of key stats or match events which indicate player performance such as “Minutes per shot on target” or “Minutes per touch in the box”. We’ve also included defensive indicators so that users who play Fantasy games where defensive actions come into play – (like Sky Sports and Play On) – can get further guidance from the tables. Indeed, stats such as “Minutes per Block” and “Minutes per Clearance” will immediately help those looking to identify defenders who are set to fare well in the new Fantasy Premier League bonus system.
All these statistics are useful in themselves when you consider that you can sort on any stat and slice the data by a Gameweek range or by home and away matches. However, the key ingredient we’ve added is the ability to create a second comparison table in the background and view tabular results that track the percentage change between the two tables. In this way, we can begin to get values that indicate form or perhaps a change in role and position. What you’ll get are results such as…
“Michu’s frequency of shots in the box increased by 23% when he played at home”
or even…
“Michu’s frequency of shots on target reduced by 38% over the final eight Gameweeks compared to the Gameweeks 1-30.”
These tables and this ability to compare frequency data can be used in a multitude of ways in order to find trends and provide quantitative data on queries such as:
- Which players improved the most for the key indicators from the 2011/12 season?
- Which players suffered the biggest decline in the key indicators away from home compared to home matches?
- Just how much did Juan Mata decline in the key attacking indicators over the last eight Gameweeks compared to the rest of his season?
- Which of the Chelsea midfield showed improvement over the same window?
- How was Robin Van Persie’s key indicators affected by Wayne Rooney’s omission from United’s lineup?
Our members will be able to use the numbers produced to help them assess how a change in position affected a player, or even just to study which players, over the “last four Gameweeks”, have improved the most over the key indicators, since last season or earlier in the year. From now on, when we think Michu has dropped off in form, we can check and get percentage values for key stats to assess whether this is really the case and, at the same time, assess if any of his team-mates have benefited.
We’ll be using the KPI tables to generate new members articles and to add further analysis to our regular members articles. We’ll be rolling out our first members article, inspired by the new KPI data, later this week to help guide your initial squad selection.
For now, take a look at the preview movie below to see the tables in action. We hope to have the KPI tables available in our Members Area later this week.
Fantasy Football Scout Memberships are now available for the pre-season price of £12.50.
Registered users can click here to upgrade their account.
New users can click here to sign up.
For further details on the benefits offered by our membership, view this page.


11 years, 4 months agoHey guys, i've seen a lot of people talking up Jay Rodriguez on here as a 3rd striker option. At the moment i'm unconvinced, does anyone have any evidence to show he's better value than Lambert? I'm struggling to be drawn away from Lambert's consistency