634x258 Community Submissions
10 December 2015 11 comments
The Fantastic Mr Fox The Fantastic Mr Fox
Share:

When assessing the defensive quality of teams, we see that some keep multiple clean sheets but tend to let in lots of goals when they do concede, while others don’t concede a lot of goals, but keep too few cleanies. This makes it difficult to rank one over the other.

Also, a defender’s total score reflects the games he played, attacking points, cards and bonus acquired, which hides the underlying score. An alternate number is needed to correctly rank the teams. To calculate this I will use a Baseline Defender who played 90 mins of all games, did not get assists or goals, didn’t get carded or earn bonuses. This player I believe would best represent the pure defensive quality of the team. I’ve taken 90 points as total possible points, and deducted four for every clean sheet lost, and one for every two goals conceded in a game.

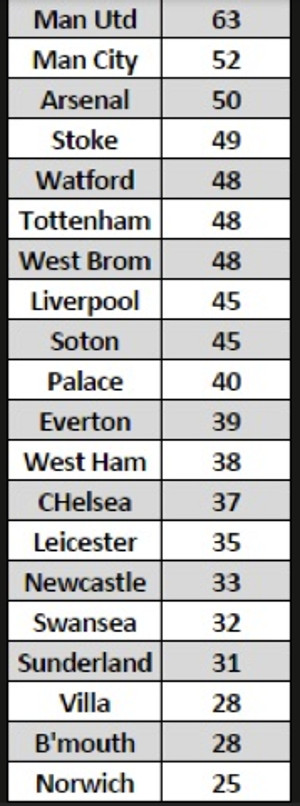
The Baseline Defender Ranking

This table is the ranking of total points by a Baseline Defender in each team
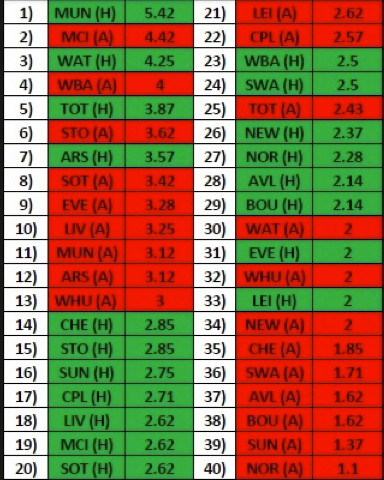
Pic1

Home and Away

This table is a split up with Home and Away performances. The points scored have been divided by the number of H or A games, to get an H or A average.

pic2

Analysis

  • Contrary to popular notion, many teams don’t defend a lot better at home. Probably because they are more adventurous.
  • The last seven sides in the split home/away table, are the last seven in the overall table and in the Premier League table. If you are defensively terrible away, you’re terrible in the league.
  • Arsenal are the only team that has similar returns, home and away. Manchester United at home and Manchester City away are exceptionally good for defensive points.
  • The drawbacks are that each team has played another only once. Pros of the analysis – it is based on actual points and gives defensive potential of team, home and away.
  • Injuries, form and fixtures so far will have affected the performances, for example Vincent Kompany’s absence appears to be a large factor in whether Manchester City concede or not.

*For statistic geeks

Median: 2.62
First quartile: 2
Third quartile: 3.2175 
Standard deviation: 0.89
95th centile: 4.4
5th centile: 0.84

11 Comments Login to Post a Comment
  1. J0E
    • Fantasy Football Scout Member
    • Has Moderation Rights
    • 16 Years
    10 years, 26 days ago

    Thanks for this. Handy stuff as we prepare our defences for Christmas

    1. The Fantastic Mr Fox
      • 11 Years
      10 years, 26 days ago

      Cheers. The edits have made it compact (y)

  2. Bobbydhino - ⚒ Saint Slav…
    • 16 Years
    10 years, 26 days ago

    Thanks for the effort, I appreciate it.

  3. Clandlewood
    • 10 Years
    10 years, 26 days ago

    Really interesting stuff. Surprised how high man city are. Am guessing it's all down to that run of cs at the start of the season?

  4. Guy Demel's SH
    • 12 Years
    10 years, 26 days ago

    Thanks for this.

    I'm guessing there's an error in the second table as West Ham are listed twice as red and (A)?

    1. The Fantastic Mr Fox
      • 11 Years
      10 years, 26 days ago

      You're right.

      It should read 32) WHU (H) 2

  5. FPL Daniel
    • 16 Years
    10 years, 26 days ago

    Lav that addition for stats geeks. Lav it

    1. The Fantastic Mr Fox
      • 11 Years
      10 years, 26 days ago

      lol. Gives that added bit to those who want to interpret more

  6. Twisted Saltergater
    • Fantasy Football Scout Member
    • 16 Years
    10 years, 26 days ago

    Surely this is heavily skewed by fixture difficulty of the 15 home/away games so far? I also think injuries play too large a part in the results over those 15 games. For instance, Arsenal with Coquelin are a different proposition to Arsenal without Coquelin.

    It works well with each extreme. I don't think anyone would argue that United have the tightest defence at home and Norwich are the leakiest away.

    I've tried using stats from last season combined with perceived fixture difficulty, and I always end up throwing it out of the window. A team's mentality, stability in defence and central midfield and lastly, quality of player seems to me to be the best indicators. I love stats though so thanks 🙂

  7. Will - Fantasy Football Hub
    • 14 Years
    10 years, 25 days ago

    Good read. Thanks

  8. Konig Luther
    • 13 Years
    10 years, 25 days ago

    great stuff