Community Submissions

A Decade of Premier League Clean Sheets

The widely held view is that the top teams tend to tighten up their defences during the latter part of the season as they chase a Champions League place or look to cling onto a title winning position. But is this really the case? This analysis looks over the last 10 seasons to find the real story behind clean sheet trends.

A Decade of Clean Sheets

HeelsOverHead’s community article on clean sheets, in addition to Chris Glover’s piece from a couple of years,  back prompted me to have a more detailed look at the clean sheet stats over the last 10 seasons.

What I found is that the widely held view that the stronger teams tend to tighten up at the back later in the season does not definitively bear up to scrutiny.

Consider these two charts of average numbers of clean sheets below (click image link here to enlarge) picked up match-by-match over the last ten seasons (each bar represents one match in a 38-match season. The black trend lines may just confuse matters as the bars do jump around somewhat, but I’ve left them in anyway in an attempt to capture any trend that might exist):

cleansheets1

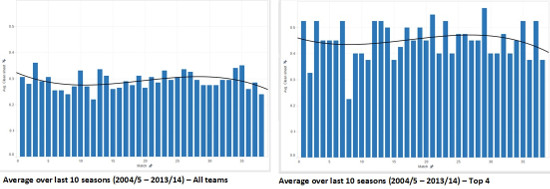
The chart on the left shows the average clean sheets picked up by all 35 teams in the league for the last 10 seasons, while the chart on the right focuses only on those teams that finished in the top four of each season.

Clearly the top four teams have a better overall clean sheet record but what I’m interested in here is the trend across the season – even if we ignore the 38th game of the season, which tends to be a lottery depending on which teams (if any) have anything to play for, the bias towards more clean sheets in the second half of the season is not immediately apparent.

The below image is another way of looking at the stats (click image link here to enlarge), with clean sheets earned in the first half of the season plotted on the vertical axis and clean sheets picked up in the second half of the season plotted on the horizontal axis. The black 45 degree line marks the point where a team has earned the same number of clean sheets in each half of the season.

cleansheets2

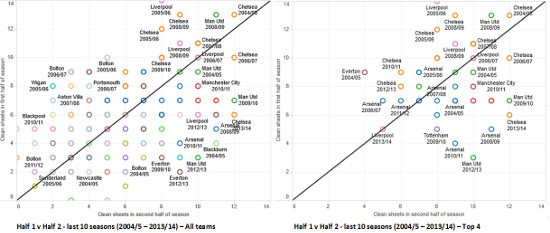
As above, this covers the last 10 seasons from 2004/05 to 2013/14 inclusive, and I’ve shown all 35 teams (amounting to 200 data points) in the left-hand chart and just the teams who finished top four in the right-hand chart (40 data points):

If the general rule of thumb is that the top teams tighten up in defence in the second half of the season, you would expect to see a lot more data points in the bottom right half of the ‘top four’ chart.

With 40 data points over 10 years, what we actually see is this:

Seasons with more clean sheets in first half of season              18

Seasons with more clean sheets in second half of season        16

Equal clean sheets in each half of season                                      6

Last Two Seasons

Before we reject the prevailing view out of hand, let’s take a look at just the last two seasons for the top 4 (2012/13 and 2013/14).

cleansheets3

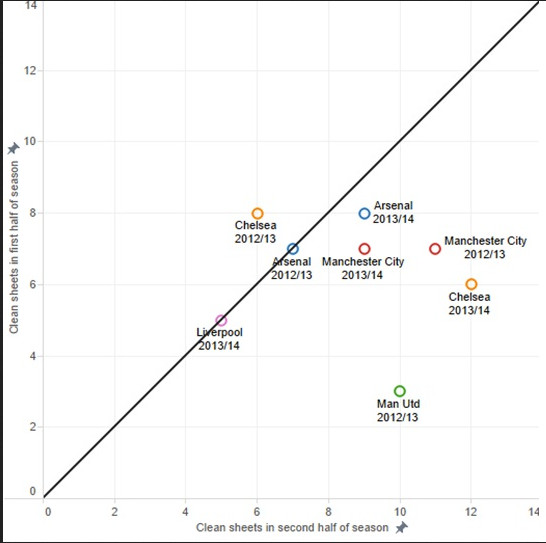
Clearly this image (click image link here to enlarge) shows a much greater skew towards the second half-season than the 10-season view, with only one team (Chelsea in 2012/13) out of eight coming away with more clean sheets in the first half of the season than the second.

Perhaps the last two seasons mark some kind of trend-setting change in favour of top-four defensive strength post-Christmas? You could probably come up with all manner of reasons for why such a trend might have manifested itself. However, I’m inclined to think this can be attributed more to statistical randomness, and that reversion to the mean, as better demonstrated by the 10-season view, will kick in before too long.

Individual Teams

What about individual team records over the last 10 seasons? Let’s pick out a few of the perennial top-four candidates.

Chelsea

The west London side is arguably the one club people have in mind when they talk about teams tightening up after Christmas.

This image shows that over the course of 10 seasons we have seven seasons with a better first-half record on clean sheets and three seasons with a better second-half record. Even under Mourinho’s tenure the record is somewhat mixed, showing two seasons with a first-half skew (2004/05 and 2005/06) and two with a second-half skew (2006/07 and 2013/14).

Manchester United

For the Red Devils there is a 4-4-2 mix of first half better/second half better/both halves equal, according to this image.

Arsenal

At first glance Arsenal look like more of a candidate for a second half rush of clean sheets, but according to this image of their clean sheet performance they have averaged 6.7 in the first half-season compared to 7.9 in the second half, a difference that is not really enough to hang an entire theory on.

Everton

Statistically, the best record for second-half clean sheets of all the teams currently in the league is Everton, a record that may have come to an end now that Roberto Martinez (and his reputation for defensive frailties) has succeeded former boss David Moyes. Click here for image.

Notes:

  • All raw data from the Premier League
  • Chart screenshots are from my own Tableau visualizations which can be found here.
30 Comments Post a Comment
  1. Owd Big 'Ed
    • 14 Years
    9 years, 3 months ago

    Excellent work mate. This must have taken a great deal of effort. I salute you.

    1. Mata-Is-The-Juan
      • 10 Years
      9 years, 3 months ago

      +100

  2. J0E
    • Fantasy Football Scout Member
    • Has Moderation Rights
    • 14 Years
    9 years, 3 months ago

    Cheers. Outstanding analysis. Chelsea defence is something that is clearly important to tap into.

    1. Woy of the Wovers
      • 13 Years
      9 years, 3 months ago

      Agreed. This is top work. Plebs like me who only look at three year's data will fall for the trap based on recent history. Proof, if ever, that memories in FPL are short.

  3. J0E
    • Fantasy Football Scout Member
    • Has Moderation Rights
    • 14 Years
    9 years, 3 months ago

    The images are best seen by clicking on the links btw.

  4. Beavis
    • Fantasy Football Scout Member
    • 12 Years
    9 years, 3 months ago

    This is amazing, thank you.

  5. John t penguin
    • 9 Years
    9 years, 3 months ago

    Really should be a limit to number of articles per month
    I suggest we split this month into two for the prize
    So every article before mine and after mine in one prize
    And every article that is mine in another
    Jonty?

    1. thepuntmaster
      • Fantasy Football Scout Member
      • 10 Years
      9 years, 3 months ago

      I disagree - even tho it would be easier to win people shouldn't be writing article to win money... If you're going to do an article do it with the right motives...

      I have 337k reads on a different site and get no money but I still enjoy it...

      1. John t penguin
        • 9 Years
        9 years, 3 months ago

        Eh think if you read comment properly you might just see what I am saying

        1. John t penguin
          • 9 Years
          9 years, 3 months ago

          On second thoughts perhaps you didn't read my comment on previous article to understand this was running joke.
          More interesting is how on earth do you know you have 337 k reads

          1. thepuntmaster
            • Fantasy Football Scout Member
            • 10 Years
            9 years, 3 months ago

            sorry dude - missed the joke 😉 feel like a bit of an idiot now 😉 just annoys me when people try and take advantage of the scouts' generosity (although obvs not you)!

            I write articles for http://www.90min.com and have 337k views there 😉

            1. John t penguin
              • 9 Years
              9 years, 3 months ago

              It was a bit cryptic I admit
              No harm bud, now I know how to stalk you more now

  6. thepuntmaster
    • Fantasy Football Scout Member
    • 10 Years
    9 years, 3 months ago

    Wow- I know how long it takes to do number crunching but those pictures/graphs too! Top effort!

  7. tm245
    • 12 Years
    9 years, 3 months ago

    Jesus, another awesome article with data and graphs! Great stuff.

  8. Solenya
    • 12 Years
    9 years, 3 months ago

    Pure hard work there mate. Brilliant.

  9. Ginkapo FPL
    • 12 Years
    9 years, 3 months ago

    But.. but .. but!

    Damn you turdbird, I was a staunch supporter of that myth, I dont know what to do anymore.

  10. The Mandalorian
    • 11 Years
    9 years, 3 months ago

    Very nice work, the community continues to surprise.

  11. John t penguin
    • 9 Years
    9 years, 3 months ago

    ok spent some time on it (well 10 min) and some questions cropped up.
    firstly can we really take into account what happened 9-10 years ago to predict what will happen in future, surely there are too many factors involved such as current tactical trends, managers and style of play, quality of players?
    secondly do you have stats for other teams in league for last few years alone. The reason why i hear you ask, well I am thinking that a key factor isnt necessarily that we expect to get loads more CS in second half, but we tend to invest more in defence by buying 2-4 premier defenders from top teams. So interested in seeing if this investment is worth it in comparison to other teams. If we dont buy from top teams in second half then we need to buy from others, so if the likes of WHU or Swansea take a turn for the worst in terms of CS then the attraction for these premium players becomes greater as the higher investment will offer better reward. If that makes sense.
    I know my first point would lead you to ask why bother with second point if you dont believe in historical trends predicting future then why ask for trends for second point, but they arent counter arguements more queries

    1. Ginkapo FPL
      • 12 Years
      9 years, 3 months ago

      Second Point -

      https://public.tableausoftware.com/views/CleanSheetHistoryteams/H1vH2?:&:showVizHome=no

      If you look at this chart and mess with the setting you will see that the bottom ten teams do no significantly lose CS's in the second half of the season, if anything they also improve slightly.

      The argument was that the top teams produce more CS's and thus many of us invested more heavily in defence after christmas as a result. We may still do so, but only because of spare cash rather than in expectation of greater value.

      1. John t penguin
        • 9 Years
        9 years, 3 months ago

        didnt load for me but you have an honest face so I take your word for it.
        thanks for clearing that up, I think people have said that there are more CS across the board in second half in the past. So maybe it is what you say and it is just us with money to burn so we automatically buy bigger names.

        doesnt help me with what to do though.

  12. Sharkytect
    • Fantasy Football Scout Member
    • 9 Years
    9 years, 3 months ago

    This is a fantastic article. I have always just assumed that vhelsea tighten up in the second half. Perhaps the big teams just concede fewer goals, rather than keepong more clean sheets, but that's a whole different set of charts...

    1. The3rdTurd
      • 12 Years
      9 years, 3 months ago

      That's an interesting question. And having already gathered 10 years worth of scorelines, it's relatively straightforward to add in stats for goals conceded, which I've now done:

      http://tinyurl.com/FPLCleanSheetHistory

      No screenshots for now but in that link you can filter on any combination you want of season, team and matchweek.

      The key stat for the top 4 for goals conceded over the 10 seasons:

      Seasons with more goals conceded in first half of season 17
      Seasons with more goals conceded in second half of season 22
      Seasons with same number of goals conceded in both halves 1

      1. Sharkytect
        • Fantasy Football Scout Member
        • 9 Years
        9 years, 3 months ago

        You absolute hero! I will check these out when i get near a computer.

        How might this influence your pwn transfers, just out of interest? Surely it tells you that if you have cash to splash in defence, it might as well go towards more attacking defenders from any team as the season progresses? After taking into accout form and fixtures, of course

  13. laGan1n1
    • 11 Years
    9 years, 3 months ago

    Rooney or Bony for next 4 games ?

  14. shortymak
    • Fantasy Football Scout Member
    • 9 Years
    9 years, 3 months ago

    you should get paid for this stuff pal

  15. applebonkers
    • Has Moderation Rights
    • 14 Years
    9 years, 3 months ago

    very glad this one has been busted. of the many things which just seemed to stick this seemed the most legit (well compared to stuff as ropey as early kick-offs, players against old-teams etc). glad to see another one busted. some stuff just gets said enough that it sticks

    1. SW6
      • 11 Years
      9 years, 3 months ago

      I'm determined to stick by the player scoring vs old teams notion.

    2. Dino
      • Fantasy Football Scout Member
      • 14 Years
      9 years, 3 months ago

      I agree ab, fwiw I never believed what they said about you and that three legged sheep no matter how many people were saying it and how often.

  16. Dino
    • Fantasy Football Scout Member
    • 14 Years
    9 years, 3 months ago

    Cracking work as always mate.

    Makes me feel a little better for going with two Chelsea defenders at the start of the season. When people double up on them in the second half of the year and they go on a run of clean sheets they can't claim that they were not more fortunate than me when I was one if the few with double Chelsea def

  17. Barry Woj
    • 11 Years
    9 years, 3 months ago

    Nice post mate. I do enjoy the debunking of a commonly held myth!