


Ahead of the Premier League restart I’ve created a new Fixture Ticker to help identify which teams have the best run of matches.
To determine fixture difficulty, the spreadsheet uses two main sources of data: Opta and FiveThirtyEight. But before delving into these two treasure troves of information, I’ll outline the unique features of the ticker.

Layout and Fixture Difficulty
Opponents are graded using colour coding where green is a favourable match and red not so favourable.
The layout features midweek and weekend matches, so Double Gameweek fixtures are displayed side-by-side.
The ticker also includes non-Premier League fixtures, with FA Cup games highlighted in purple. This gives you an idea of the extra workload for participating teams, and perhaps an indication of priorities. Remember Pep’s quote from March:
Madrid and Newcastle are the real important games for us.
– Pep Guardiola
(Note that Champions League matches are due to take place in August.)
At the end is a column indicating the total projected goals as determined by FiveThirtyEight. More about this feature later. And on the left, next to the teams, is a colour scale to indicate fixture difficulty for your chosen ‘Sort By’ option.
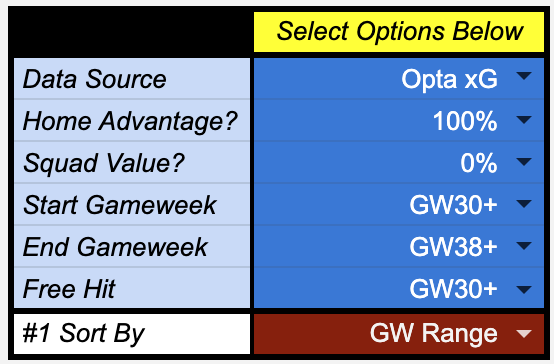
Adjustable Parameters
To the left of the ticker is a control panel where you can select various options.
You can adjust your start and end Gameweeks, as well as deciding on a ‘Free Hit’ Gameweek, should you have that chip available. The Free Hit Gameweek will not be counted towards the fixture difficulty total.
You can sort teams by your selected Gameweek Range or any individual Gameweek.
Aside from picking your preferred data source for the ticker, you can also adjust Home Advantage and Squad Value.
Home Advantage
As Pro Pundit Zophar observed, home advantage has been severely diluted in the empty stadiums of the Bundesliga. This could simply be an anomaly or the effect could be real – you can decide!
The ‘Home Advantage?’ dropdown menu allows you to reduce the benefit of playing at home. A selection of 100% means home advantage counts, whereas a selection of 0% means there is no difference between playing at home or away.
Squad Value
After such a long break, it’s hard to know what kind of performances to expect from teams. A number of players will have recovered from injury, while managers and coaches will have spent time working with their squads on new ideas and tactics. In a sense, this is like a new season.
It’s been noted on FiveThirtyEight that:
A team’s squad value — relative to their league’s average value — is strongly correlated with its end-of-season [position].
– FiveThirtyEight
Using the ‘Squad Value?’ dropdown menu you can add a squad value element to the ticker. Up to 30%.
The squad value information is based upon the data from TransferMarkt. Manchester City and Liverpool have by far the highest value collection of players.
| Team | Squad Value in millions (Euros) |
| Manchester City | 1,020 |
| Liverpool | 979 |
| Tottenham Hotspur | 714 |
| Chelsea | 678 |
| Manchester United | 648 |
| Arsenal | 571 |
| Everton | 417 |
| Leicester City | 408 |
| Wolverhampton | 298 |
| West Ham United | 293 |
| AFC Bournemouth | 276 |
| Newcastle | 253 |
| Aston Villa | 225 |
| Brighton and Hove Albion | 196 |
| Southampton | 194 |
| Watford | 193 |
| Crystal Palace | 174 |
| Burnley | 159 |
| Sheffield United | 135 |
| Norwich City | 133 |
Opta xG
Our first data source is Opta’s Expected Goals. The biggest name in football statistics, Opta produce a wide array of valuable metrics.
Expected Goals (xG) is a measure of chance quality. It aims to quantify the likelihood of a goal being scored from a particular shot. It does this by incorporating various parameters, including Big Chances and shot location.
It is the best predictor of future team performance.
To estimate fixture difficulty, I’ve used a team’s expected goal data from this season and coupled it with their opponent’s expected goal conceded average.
I’ve enhanced this calculation by factoring in each team’s finishing ability – the difference between their expected goals and goals scored.
Opta’s xG does not consider who takes the shot. The better (and richer) teams tend to have the best finishers. Simply put, it makes a difference if Sergio Agüero or David McGoldrick is on the end of a chance.
So using the data from the last three seasons, I’ve calculated how each team performs in relation to their expected goals scored and conceded.
538 xG
For those of you who don’t know, Fivethirtyeight.com is the politics, economics and sports forecasting blog created by the American statistician and former poker player Nate Silver, the author of The Signal and the Noise.
There are two crucial differences between FiveThirtyEight’s expected goals and Opta’s:
Firstly, it does take into account who takes the shot. Each player with enough shots in the database is given a modifier based upon their historical conversion rates (the number of goals they’ve actually scored, given the quality of the chances they’ve had).
Secondly, FiveThirtyEight also measure non-shot expected goals. This quantifies every action that takes place around the opposing team’s goal – passes, interceptions, take-ons and tackles – that does not result in a shot.
Non-shot xG tells us more about team performance than shot-based xG alone. For instance in the 2016/17 season, Arsene Wenger’s Arsenal had an impressive non-shot xG of 97.62 but an xG of 73.84. It must have been very frustrating for Arsenal fans to watch their team get into good positions inside their opponent’s penalty area without getting shots off.
I’ve combined FiveThirtyEight’s shot and non-shot expected goal data to give a better overall picture of team performance.
So while FiveThirtyEight may not include useful subjective measures like Opta’s Big Chances, their xG does have a couple of useful metrics of its own.
538 SPI
The third data source you can select for the fixture difficulty ticker is FiveThirtyEight’s Soccer Power Index or SPI.
The SPI is an estimate of overall team strength. It is based upon an attacking rating that represents the number of goals a team would be expected to score against an average team in a neutral stadium, and a defensive rating that represents the number of goals it would be expected to concede.
I’ve split these attacking and defensive ratings into home and away – although setting ‘Home Advantage?’ to 0% would restore the original neutral stadium ratings.
538 Projected Goals
FiveThirtyEight predict the number of goals a team is expected to score in a match.
When selecting this source I’ve disabled ‘Home Advantage?’ and ‘Squad Value?’ as these factors have been taken into account, for instance FiveThirtyEight have reduced home advantage by 10 percent.
Ahead of each round of matches, FiveThirtyEight estimates the importance of the fixture to each team. This is determined in relation to winning the league, the possibility of being promoted or relegated, or qualifying for the Champions League.
FiveThirtyEight note that when a match is more important to one team than the other, that team tends to outperform expectations, with its boost in performance relative to how much more important the match is to them.
However if a match isn’t important to either team, uncertainty in the outcome of the match increases.
It’s worth noting that Manchester City have been assigned an importance factor of zero for both their upcoming matches – they are extremely unlikely to retain the title. Whereas Manchester United have a score of 89.4 out of 100 based upon their need to qualify for the Champions League.
FiveThirtyEight combine all of this information together to produce their projected goals total.
Conclusion
I hope you enjoy the fixture ticker and find it a useful tool for making those all-important transfer decisions. For your own interactive ticker you will need to make a copy by signing in to your Google account and selecting “File>Make a copy”. The ticker can be linked to here.
The source data will be updated every Gameweek.
Best of luck for the remainder of the season!


