With all 20 Premier League clubs having now played at least six fixtures, the underlying stats tables we pore over in the Premium Members Area of Fantasy Football Scout start to become that bit more reliable.
Six/seven matches is still a small sample size, granted, but already we are seeing some predictable patterns emerge: title-chasing Manchester City, Arsenal and Tottenham Hotspur are among the top five clubs for both expected goals (xG) and expected goals conceded (xGC), for instance, while newly promoted Bournemouth and Nottingham Forest languish in the bottom five for each.
Something to consider when studying these figures, however, is fixture difficulty.
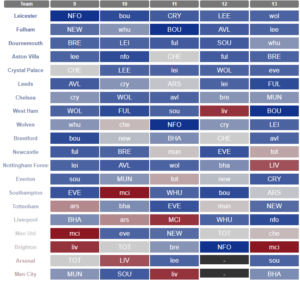
Crystal Palace may be towards the wrong end of the table for xGC, for instance, but look at who they have played in the opening six Gameweeks:

With this in mind, we’ll take a quick look at how all 20 Premier League teams are doing on the expected goals front when compared to how ‘easy’ or ‘difficult’ their opening set of fixtures were.
Establishing Fixture Difficulty

What constitutes an easy/difficult fixture is hugely subjective, of course.
To establish some form of grading system, we have ranked teams by the following criteria:
- Average fixture difficulty rating (FDR) on the official FPL site, using the current ratings
- In the event of a tie, clubs are ranked according to who came highest on our very own Season Ticker, again using the current ratings
Why not just use the Season Ticker and the ‘sort by difficulty’ function for the whole thing? In short, the Gameweek 8 postponements. The six clubs who blanked in the Gameweek just gone have plummeted down the Season Ticker as a result of their non-involvement, even though in some cases (eg Liverpool, Chelsea), what went before could definitely be described as ‘favourable’.
While you may certainly quibble a place or two here and there (Brighton and Hove Albion probably ought to be higher than 10th, given that they encountered Manchester United and West Ham United at good times), the rankings at the very least provide us with a rough, at-a-glance guide when we’re trying to put the xG/xGC figures below into some context.
Expected Goals (xG) v Fixture Difficulty
| Team | Mins per Expected Goal (xG) | Fixture Difficulty Ranking (Easiest = 1st, Toughest = 20th) |
| Man City | 44.2 | 2nd |
| Liverpool | 49.7 | 5th |
| Arsenal | 50 | 7th |
| Brighton | 53.1 | 10th |
| Spurs | 53.9 | 3rd |
| Leeds | 59.1 | 6th |
| Newcastle | 61.9 | 15th |
| Brentford | 62.6 | 4th |
| Man Utd | 66.7 | 12th |
| Chelsea | 74.4 | 1st |
| Fulham | 80.6 | 17th |
| Crystal Palace | 81.1 | 20th |
| Everton | 85.5 | 9th |
| Leicester | 85.5 | 18th |
| West Ham | 88.6 | 16th |
| Nottm Forest | 88.9 | 11th |
| Wolves | 98.5 | 13th |
| Southampton | 100.1 | 8th |
| Aston Villa | 110.7 | 14th |
| Bournemouth | 205.2 | 19th |


